Welcome to our third blog in this collaborative series with World Wide Generation, where we look to explore the possibilities automation and AI can offer sustainability reporting as the world collectively embarks on a global sustainable transformation. Missed our previous blog? Read it here: blog 2.
Automated sustainability deficit targeting on various levels
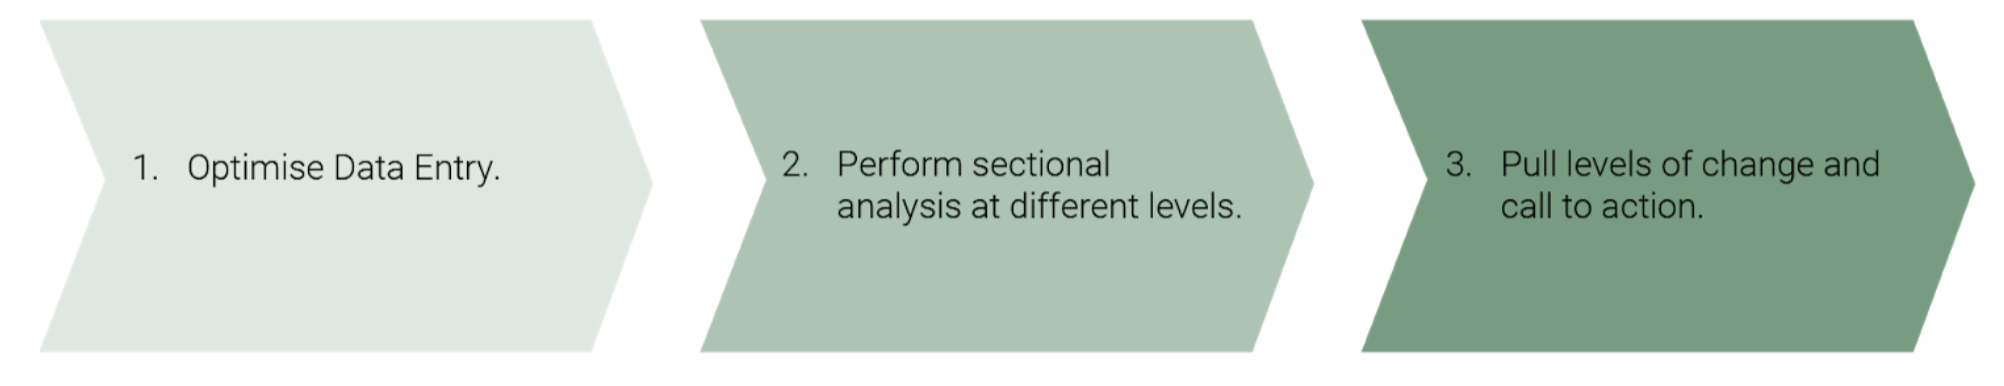
73% of impact investors are using SDG’s[1] for measurement and management purposes so it is without any doubt easy to see why the sustainable development goals are growing in relevance and importance; however, the current trajectory in attaining the UN Agenda 2030 and the SDG goals (according to the 2020 Sustainable Development Goals Report) implies we are off track and due to miss the 2030 target. Whatever the reason for missing the target, the result is clear: companies are calling for an optimized way to identify and report how they contribute to the SDGs. In this blog we discuss techniques to (1.) Make the user journey far less painful by optimizing the SDG data entry process using AI. (2.) Manage data roll-up to global level to then (3.) Empower Companies, Governments and Cities to act simultaneously on delivering the SDGs based on data and scientific eviden
Rolling up and down various levels
Understanding SDGs and leveraging the potential they represent to the sustainability of our economies will require collaboration between a critical mass of companies across industries and entire economic systems.
Implementation of the roll-up model needs to be consistent and should address scope, boundaries and magnitude of their impact, which we can define as the areas of influence. These factors determine SDG adoption rates. Assessing delta, the change in influence over time, is a measure for these adoption rates, breaking this down at sectoral level can show change across industries to draw comparisons. Let us use the example of a pharmaceutical company. Thousands of employees have their own areas of influence. Or are equity holders that possess influence? Is it products sold (such as vaccines) and their geospatial proximity that possess influence? Then what are boundaries of influence? Once a product is used and disposed of, there is still an SDG contribution of the waste which is managed, how can this be rolled up? At what point in the value chain does the rollup of SDG impact dissipate? The sustainable development goals are interwoven into products, people, companies and regions – everybody has a role to play.
On the mathematical side of roll up, error rates will increase as you travel up the chain; from product level to company level, to investor level and so on – small errors in SDG contributions can be compounded the further up the supply chain you go. Whereas overall value split on the way down is more likely to be accurate, using audited metrics to roll down to product level. Product is an excellent indicator of influence as customers and supply chains are captured in the modelling and identifying SDG impact of single products is key in achieving this.
Orchestrating data to create a benchmark or datum, is not a ‘one size fits all’ demand. Data must be collected from relevant sources to calculate a useful score. The monitoring of contributions and deficits may for instance be required on a global level or other hierarchically lower levels. In rolling up or down these levels, we distinguish:
- Company Level
- Portfolio Level (Investors and Financial Institutions)
- City Level (City Tracker)
- Regional Level
- Sector level
- Government level
- Global Level
The benchmark resulting from data on these levels offers the possibility to improve communication and cooperation in achieving the SDGs efficiently and swiftly. It also enables identification why certain players are lagging behind to make valuable suggestions for improvement.
Overview advantages
Roll up benefits companies by developing roadmaps to guide their sector’s shift to sustainable development. By first establishing the current standing of the company and their contribution gaps by performing sector analysis, organisations can pull levers such as further investment or regeneration as a call to action.
As one of the greatest problems in sustainability reporting is lack of data submitted by entities at various levels, by automating data entry onto the G17Eco platform we benefit from an uplift in accurate, timely and robust data. On one level, investors have the opportunity to observe companies generating substantiated SDG contributions vs peers and could use this to generate asymmetric, uncorrelated returns (alpha) depending on their investment strategy. More holistically, governments and cities could strategically tailor policies to pull specific levers based on empirical data based on their sectoral analyses.
Rollup analysis allows countries to prioritize action toward SDG deficits split across sector and region. Conversely, reporters can demonstrate good practice, allowing identification of leaders and laggards. The overarching idea is that metrics can be reported to different sectors, companies and regions in the form of notifications.
What is needed to make this happen?
Onboarding of customers is key to pulling more data to accelerate the roll up process (one requires data initially to be rolled up to the company level);but how does one quantify SDG contributions of a single product such as an online purchase? Apportioning of company level data by normalising company level contributions, say by production numbers, can derive a model for SDG contribution per product. When used by customers in online shopping baskets, consumers can track products to determine the contributions of contents in their shopping baskets. Better contributions could be rewarded in the form of vouchers to reward good behaviours. The support base of customer level data can start a viral effect in getting everyone involved to contribute to sustainability. It is important to note that a critical mass is required until there is sufficient data to inform cross referencing between product level data and company level submissions and upwards to city and country.
The problem of missing or incomplete data can be handled using data imputation. There are several ways of doing this, the most common form being mean imputation, using the average. The disadvantage is when there is a lot of missing data, the average could deviate from the real-world mean. Another method is substitution and using AI to augment missing data from various sources. .The next best method is to choose a value based on the score of a company in the same sector (peer to peer analysis).
Lord Calvin once stated “If you cannot measure it, you cannot control it”. By rolling up data and aggregating from various sources we can measure gaps and find blind spots (using AI to pull more data) to address the SDG agenda holistically. However we also find companies ticking all the right boxes but missing the big picture. Speaking of which, how can we use image classifiers such as Convolutional Neural Networks (CNNs E.g. AlexNet https://pytorch.org/hub/pytorch_vision_alexnet/) to measure impact using image data? The answer? To be continued…
Reach your sustainability goals with WWG and Be Informed
G17Eco by WWG offers standard frameworks, policies and a taxonomy as the basis for reporting on sustainability. Start a survey on the platform to report against SDG’s. On the platform you can delegate all kinds of questions from one place to different user levels; it is no longer necessary to gather information in different spreadsheets. Data is represented in an easy, well-formatted way. Be Informed then orchestrates the reporting standards, fast-tracking the process of mapping duplicates and stringently aligning reporting metrics. Immediate insight in the automated sustainability deficit targeting on various levels are offered through the very comprehensible dashboard. This shows all rankings of importance to your SDG targets. All you need to do is get everyone on board and use the predictions, analysis and identification of gaps to reach the sustainability goals you have set.
Missed our previous blogs? Read them here: blog 1 and blog 2.
[1] https://www.youtube.com/watch?v=L810Rlo-cys&ab_channel=TruvalueLabs
[2] https://www.cdp.net/en/articles/media/comprehensive-corporate-reporting